Translating Raw SAT Performance Data Into a Ranked Gap Profile
A three-axis method reveals which skills to fix first and how much you'll gain.
SAT prep with personalized knowledge mastery should tell you why you keep missing questions, which concepts cost you the most opportunities, and what to fix first. Translating raw SAT performance data into a ranked gap profile means combining accuracy, exam frequency, and fixability, then checking whether a missing prerequisite explains the errors. A short study order with reasons behind it gives specific direction to “practice more.
Why raw SAT score reports already contain a gap profile — and why most students miss it
Bluebook’s Digital SAT score report already sorts performance into recognizable skill domains. In Reading and Writing, the domains are Information and Ideas, Craft and Structure, Expression of Ideas, and Standard English Conventions. In Math, the domains are Algebra, Advanced Math, Problem-Solving and Data Analysis, and Geometry and Trigonometry. These labels are more than report furniture. Each points to a set of tested skills, so the report already contains the organizing structure for diagnosis.
It is easy to let the total score become the whole story. You look at it, notice which section is lower, and leave with a broad intention to study that section. That is an understandable response to a report presented as a result. But “work on Math” leaves the central question unanswered. Which skill is actually responsible for the misses?
To answer that, treat the domain breakdown as the starting point for investigation. It identifies where to look, without yet explaining what happened there. Finding the weak area still leaves the job of locating the broken part.
What a ranked gap profile is and what it requires beyond accuracy rates
A ranked gap profile is a prioritized ordering of specific skill gaps, with an explanation of what to fix first and why. It is not a scrapbook of wrong answers. The finished profile usually contains five or fewer priorities, each identifying the domain, sub-skill, root cause, and estimated payoff from fixing it.
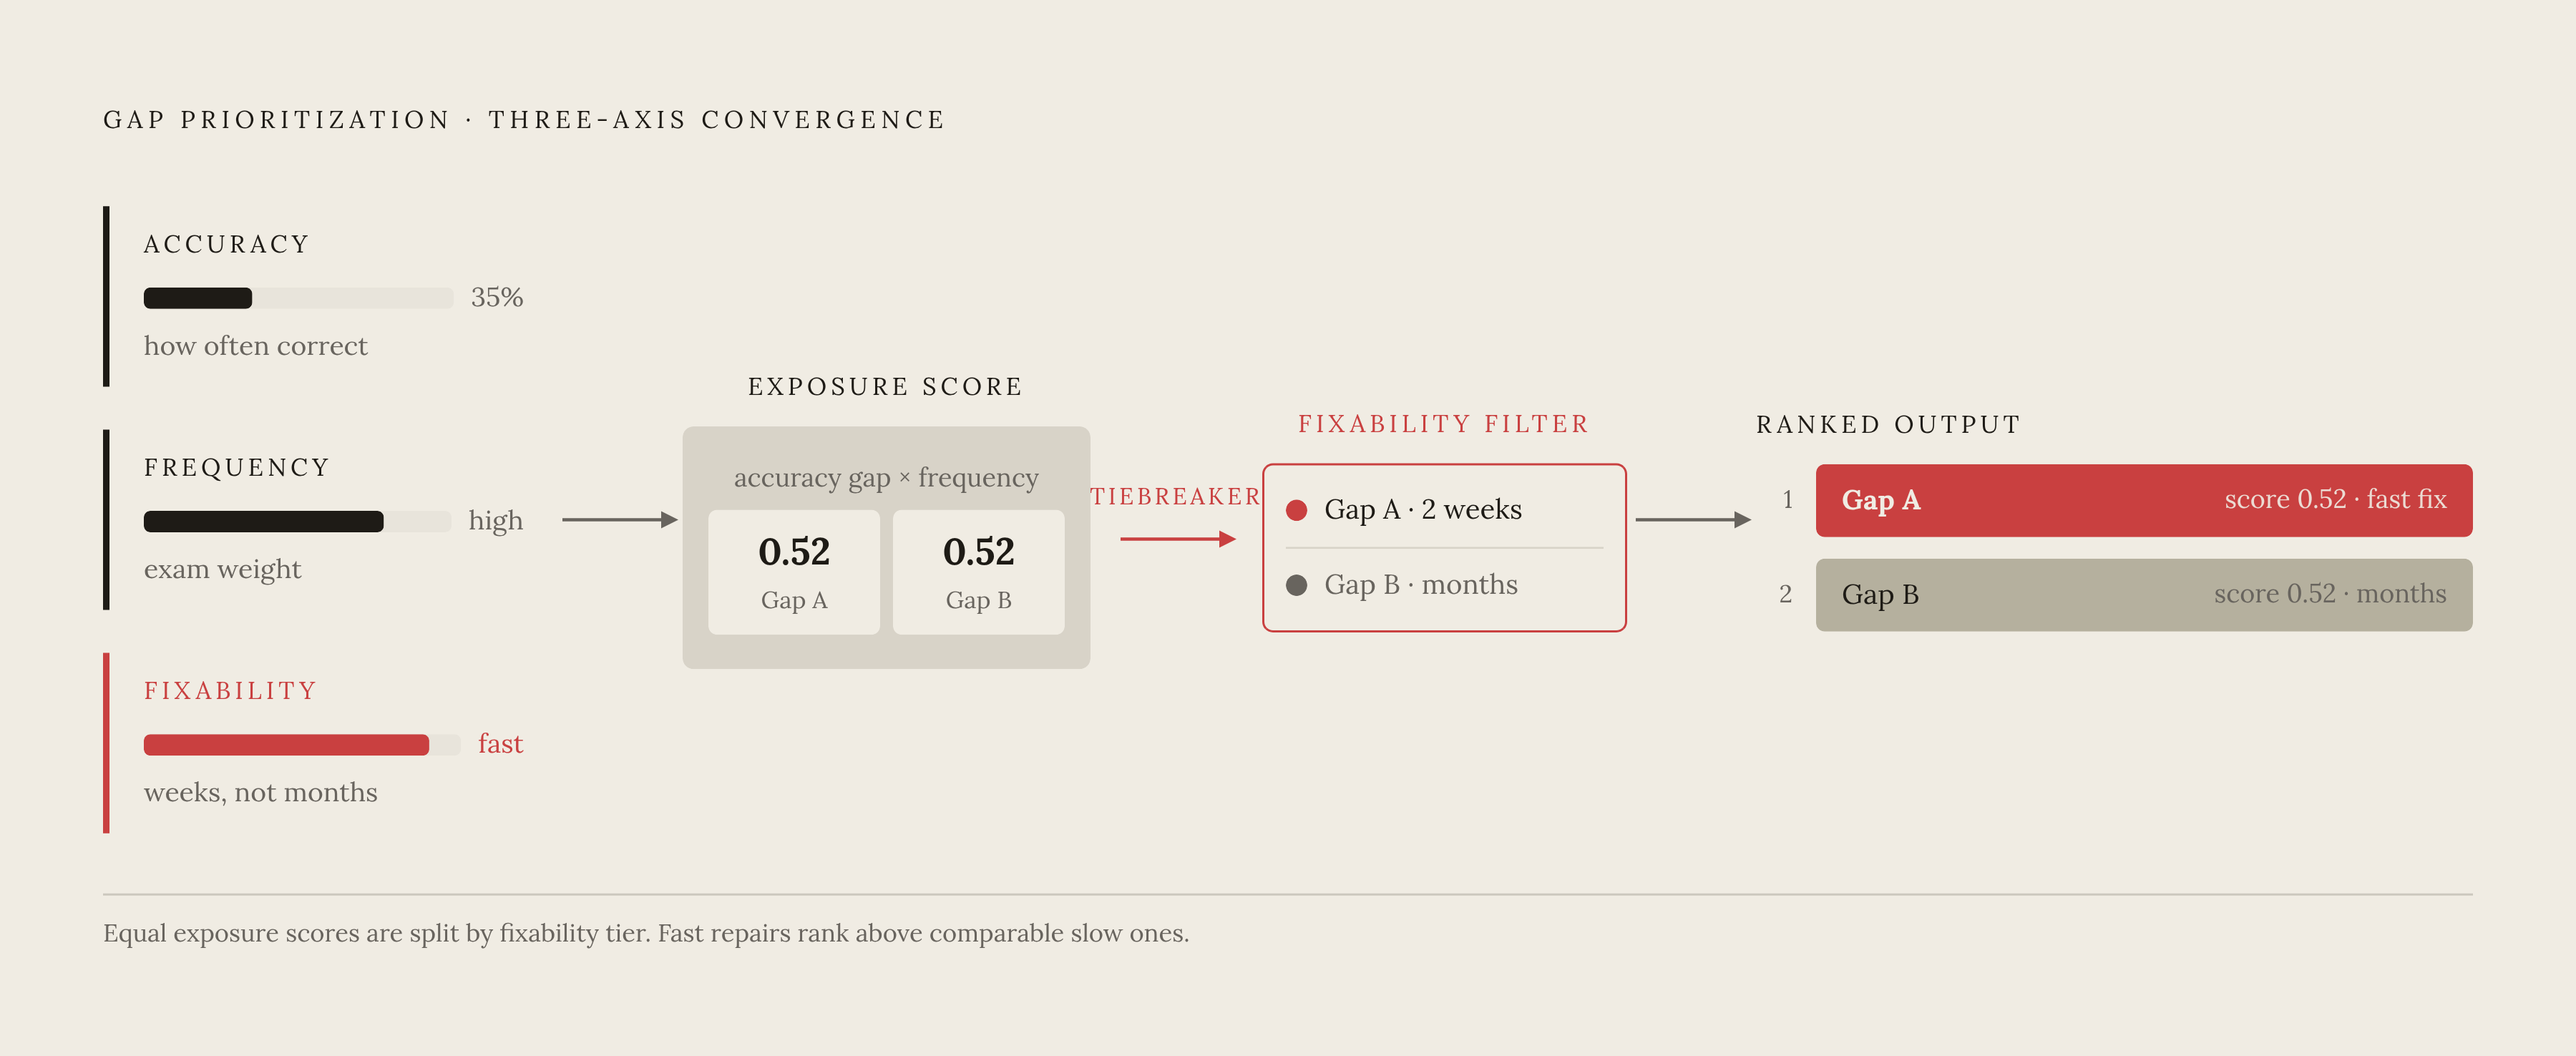
Three axes determine the order. Accuracy tells you how often you get a skill right, frequency tells you how often the exam tests it, and fixability estimates how quickly targeted work could close the gap. None is enough alone. Low accuracy in a rarely tested area may deserve less attention than middling accuracy in a heavily tested one, while a quick repair may outrank a comparable weakness that needs substantial rebuilding.
ALIGNAgent’s Skill Gap Agent shows this difference with a proficiency map for each topic, a list of topics in order of priority, and reasons for the gaps. The useful feature connects an estimate of proficiency with a reason for the next learning step.
Step 1 — Grouping every question by tested skill and computing a per-domain accuracy rate
Start with the questions from your practice test or the question-level information available with your results. On paper or in a spreadsheet, assign each question to one of the eight Bluebook domains. Count the questions you tried in each domain, then count how many you got right. Divide correct answers by attempted questions to get the domain accuracy rate. Keep both counts beside the ratio.
Those counts are part of the evidence. Two questions with one wrong answer produce the same accuracy rate as a much larger set with half wrong, but the smaller sample gives you less reason to trust the pattern. If fewer than four questions contribute to a domain’s rate, flag it as unreliable. Confirm it on a second practice set before including it in the ranking. Geometry and Trigonometry especially needs this check because most forms contain fewer items there than in Algebra or Advanced Math.
Next, revisit how you reached each answer. Tag it as confident, uncertain, or a guess, where you can recall that honestly. For the mastery estimate, subtract the guesses you got right from the correct count before dividing by the number of questions you tried. Leave the attempted count unchanged. A lucky answer can earn credit on a test even if the skill behind it is still shaky.
Step 2 — Labeling each mistake by root cause, not just by domain
Now take three to five wrong answers and practice labeling why each went wrong before you work through the full set. This is the hardest part to do alone. You are reconstructing the decision that led to your answer. For each miss, name the sub-skill it tested and give it a root-cause label before moving on.
Use four labels, namely conceptual gap, procedural error, reading error, and time pressure. A conceptual gap means you did not know the rule, while a procedural error means you knew it but applied it incorrectly. A reading error means you misread the question, and time pressure means pace forced a guess. The distinction changes the remedy. Three conceptual misses in Algebra call for different work from three procedural slips in the same domain.
But the domain where an error appears is not always where it begins. An Advanced Math problem can expose an Algebra concept that was never consolidated. When a higher-level miss looks conceptual, check whether accuracy is also low in the prerequisite domain before you decide where to rank it.
Step 3 — Applying exam-frequency weights so the ranking reflects actual score impact
Frequency changes the meaning of an accuracy gap. Algebra and Advanced Math together account for the largest share of Math questions, so weakness there creates more exposure than an equivalent weakness in Geometry and Trigonometry. The same comparison holds for Reading and Writing. Information and Ideas and Standard English Conventions both come up often on the exam, so the name that sounds more urgent should have no bearing on which comes first.
The arithmetic is simple enough for a spreadsheet. Multiply the accuracy gap, calculated as 1 minus the domain accuracy rate, by the number of questions that domain contributes to the section. This calculation yields a raw “missed-point exposure” figure. It gives a rough count of missed opportunities in that domain, but it cannot tell you the exact scaled-score gain.
To see the calculation without inventing exam counts, suppose your accuracy is half in both Algebra and Geometry and Trigonometry. Each accuracy gap is then 1 minus one-half. Multiplying that gap by each domain’s question count gives half of each count as its exposure. Algebra ranks higher when it contributes more questions.
Sort by exposure before judging repair time so the lowest percentage does not get your attention first just because it is low, even when it covers few questions.
Step 4 — Scoring each gap for fixability so the final ranking reflects effort-to-payoff ratio
Exposure shows where improvement could pay off, but it does not show how much work improvement requires. Among gaps with comparable exposure, assign fixability tiers of fast, medium, or slow. Root cause guides that judgment. Procedural errors and reading errors are usually quicker to fix than deep conceptual gaps, especially when those gaps stem from an unmet prerequisite.
Consider misreading “least” as “most” in word-problem setups. A targeted drill on question-reading habits can address that narrow error quickly. Unconsolidated linear systems present a different job. The student needs to rebuild the concept. A gap that needs months should not automatically outrank a comparable one that could close in two weeks.
With little time left, give fixability more weight than you would with three months of runway. Within the same exposure tier, rank fast repairs above medium and slow ones so early gains feed into the next diagnostic cycle. Deeper concepts remain important even when scheduled for later.
The agent framework links quantitative proficiency measures with qualitative explanations to inform its Recommendation Agent’s choice of learning materials. Without software, the diagnosis likewise guides the choice of work and its topic.
Producing the final ranked list — what the output looks like and how to read it
An illustrative first entry could be written as a sentence. “Rank 1 is Advanced Math, with a conceptual gap in quadratic equations, high exposure, and medium fixability.” Your evidence must support placing that gap first.
Each subsequent entry follows the same pattern, naming the domain and sub-skill, root cause, exposure score, and fixability tier. Keep the profile to no more than five entries. Smaller gaps can wait until the leading priorities close. The domain and sub-skill name what to study, while the cause distinguishes concept rebuilding from procedural drill or question-reading practice. Fixability supplies the rough time budget.
Read the ordering as a snapshot of your ability. After the next practice test, go through the process again so the gaps you have closed leave the front of the queue and the ones you have just found get attention. The framework’s continuous feedback loop updates the proficiency map after each interaction and calls for work on gaps before moving to the next topic.
Where the translation process breaks down and how to catch it
Sparse data can make a single practice test’s domain rates look more decisive than they are. Before finalizing the ranking, run the process across at least two practice tests and use the average domain accuracy. Mislabeling a conceptual gap as procedural sends you toward drills when the concept itself needs rebuilding. When unsure, explain aloud the rule needed to answer the question you got wrong, and take trouble explaining it as a sign of a conceptual gap. The spreadsheet cannot make that distinction for you.
A prerequisite mismatch can put Advanced Math first even when an unconsolidated Algebra concept is the actual source of difficulty. Whenever a root cause is conceptual, check accuracy in the prerequisite domain and work on that domain first if it is weak. Georgia Tech’s 2026 pipeline maps questions onto topics connected by a prerequisite knowledge graph. However, its authors say that per-student propagation along those connections is what they plan to analyze next and has yet to be shown in their results. That limitation is important to preserve.
Detection also stops short of instruction. Even when you are right to rank Transitions first, you still need to learn the logical reasoning rule that governs transitions. Toward Measuring AI’s Effects on Skill Formation: The Stock–Formation Gap identifies the risk that AI-assisted task performance can improve without a corresponding gain in later unassisted capability. For an AI-assisted profile, verify that you can perform the skill without the tool. A better-looking result is not always better-held knowledge.
How can AI SAT prep explain repeated mistakes without replacing your judgment?
An AI tool earns its place by speeding up the parts of this process that involve sorting, counting, and updating. It can group questions by domain, compute accuracy rates, surface patterns across practice sessions, and flag possible prerequisite mismatches. The more demanding criterion is diagnostic specificity. Does the output identify a sub-skill and explain the suspected cause, or does it merely prescribe another batch of questions?
The tool should provide domain-level and concept-level signals, explanations of repeated misses, and a view of proficiency that updates as answers accumulate. Then examine whether the tool distinguishes genuine understanding from a correct guess. Without that distinction, the fixability estimate rests on shaky ground. Automation should reduce clerical work without concealing uncertainty.
Passionfruit has unlimited, high-quality practice problems with AI-powered grading, instant score breakdowns, and performance insights that help show what you do well and where you struggle. Those domain-level and concept-level signals go into a ranked profile without you having to build a spreadsheet by hand. Its grading layer links practice attempts to the proficiency map, updating the profile after each session. That makes it an option for students who want the arithmetic automated.
The student still has a job here. Check whether what looked like a conceptual gap was really a procedural slip, and whether a skill you seemed to have mastered was helped by a lucky guess. The Skill Gap Agent illustrates the same division of labor, with proficiency estimation and gap identification handled at scale while the student or instructor interprets the explanations. The test of useful personalization is what you can explain and solve when the help is gone.